Overview
In the Reports area, the Overview report is essentially a dashboard that gives users a quick update of certain aspects of their account. This includes point-in-time updates on their incoming and outgoing messages, a breakdown of overall disk usage, and spam counts and viruses caught.
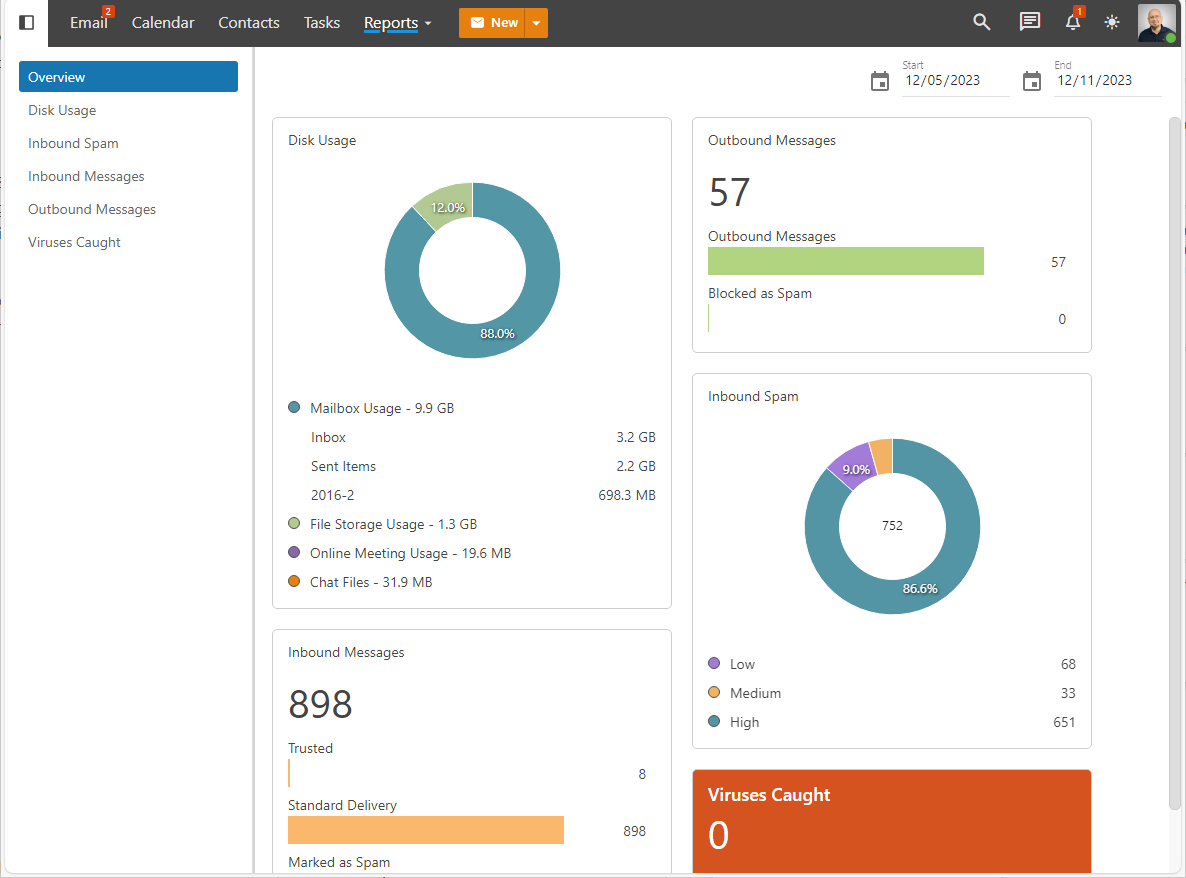
The cards on the dashboard include:
- Disk Usage - The overall disk space being used, which includes message data as well as file storage and online meeting storage. The “top” folders are listed as well. If a user is set to "unlimited" disk space, the circle chart displays how the disk space is being used. For users with a disk space limit, the chart will also show how much "free" disk space is available. The graph shows the percentage of the total spaced used by each category. (If the spaced used percentage is less than 1, it will display in the graph as 0%.)
- Inbound Messages - The total number of messages received by the user in the given period. This includes messages received from trusted senders, messages delivered via standard delivery and messages marked as spam.
- Outbound Messages - The total number of messages sent by the user in the given period, including a separate item for outgoing messages that were blocked as spam.
- Inbound Spam - The total number of messages marked as spam, with a breakdown of the 3 spam levels: High, Medium and Low. The graph shows the percentage of the total for each spam level. (If the spam % is less than 1, it will display in the graph as 0%.)
- Viruses Caught - The total number of viruses caught and quarantined by SmarterMail for the given period.
Copyright © SmarterTools Inc. All rights reserved.